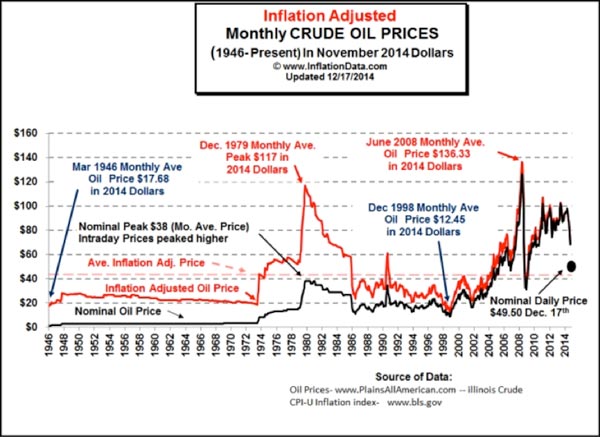
The following chart shows crude oil prices from 1946 to the end of 2014. It shows nominal prices and inflation adjusted values. It is interesting to see that since the year 2000, volatility has increased massively and a sequence of severe corrections and quick rebounds has ensued. This seems a trend that should continue. We also note a long trading range in the 1980s and 1990s. Before the volatile period of the 1970s, oil was a very quiet commodity flat-lining for about 30 years.