The following blog has been written by Davide Accomazzo in collaboration with Dr. Clemens Kownatzki, Professor of Finance at Pepperdine University, Graziadio Business School.
As we research ideas and opportunities to mitigate the rising danger of volatility in our portfolios, we are naturally driven to history as it provides us with interesting case studies of market action during turbulent times.
In this journey down memory lane, we came across an interesting table produced by Research Affiliates. The included data provides a window into the top 10 tech companies in the year 2000 and their performance in the following 19 years.
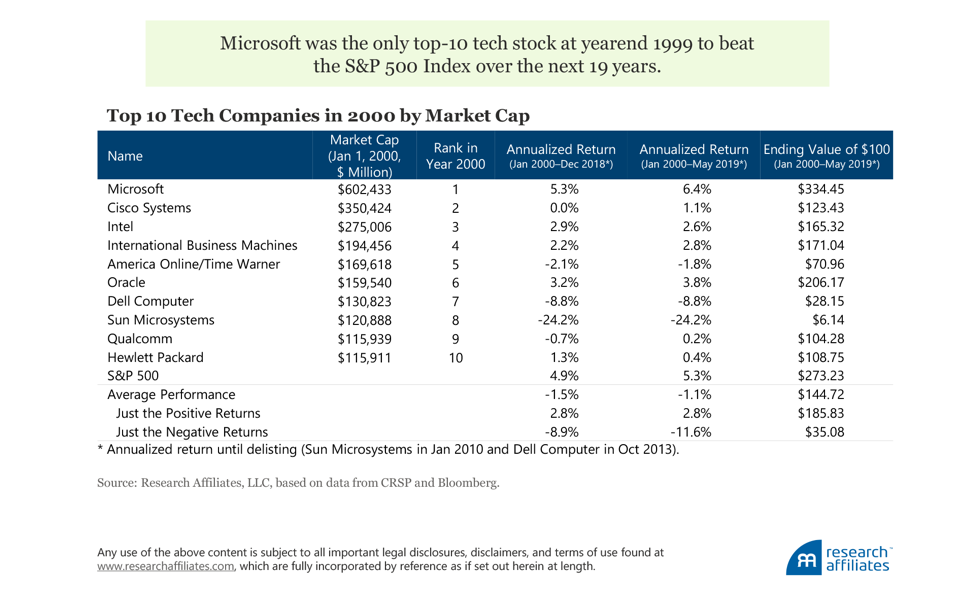
Interestingly, the only name on the list to barely outperform the S&P 500 benchmark was Microsoft. This is not entirely surprising as the valuation levels of the year 2000 in the technology sector were definitely excessive. However, the data also reveal another controversial element that relates to the timely debate of passive versus active investing. Those expensive names in the list happened to be top ten by market cap and therefore represented a large component of the index. What this means is that an index like the S&P 500 that is based on the market capitalization of its components (the larger the capitalization, the larger the weight in the index) is inherently exposed to increased exposure to the most expensive names.
Let’s forward to today and let’s see if there is a lesson to be learnt from what we just discovered. The tech sector has been on fire for the better part of the decade but clearly jammed in the last 12 months when performance flattened and became rather choppy. Take your favorite pick of culprits for the challenges in the tech sector – trade war, Brexit, slowdown in Europe, geopolitical risks or high valuations. That said, valuations in most tech giants are high but they do not seem to be as outlandish as in the year 2000. In essence, while we might not be in clear danger territory, as they say in Wall Street, the easy money might have been made by now.
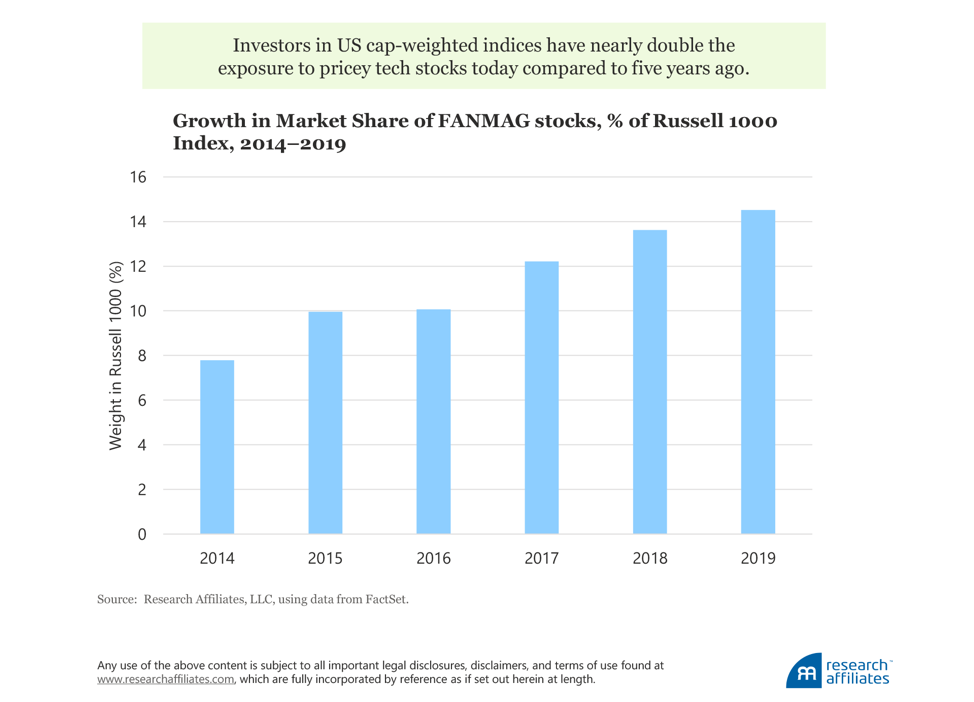
On the subject of market cap, Research Affiliates presents another timely chart; the following graph shows the growth in market share of the notorious FANMAG stocks (Facebook, Amazon, Netflix, Microsoft, Apple, Google) as a percentage of the Russell 1000 index (also market cap weighted) from 2014 to 2019. These six stocks produced 40% of the returns of the Russell 1000 index over the 2014-2019 period and their weight in the index practically doubled.
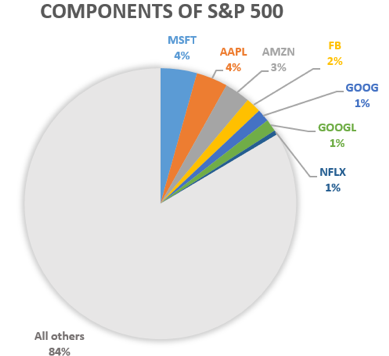
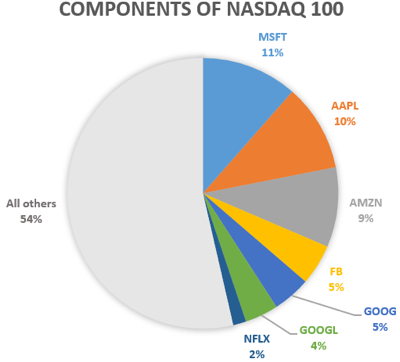
To put things in perspective, the same six companies hold even more prominent weightings in the S&P 500 and the NASDAQ 100. The FANMAG stocks currently represent 16.46% of the S&P 500 and a staggering 46.41 % of the NASDAQ 100. Some investors, who invest in an index fund to capture returns of the index while seeking diversification may not be aware of the immense concentration risk they hold. When almost half of an index is weighted towards only six companies, as in the NASDQ 100, some alarm bells should ring.
Data as of August 29, 2019
Could we be on the cusp of a turning point when value and active investing might start outperforming momentum and passive investing? If the past is any indication, one might also question whether the phenomenal performance of companies like Apple and Amazon can be replicated in the coming decade(s) or whether some form of a reversion to the mean might occur.
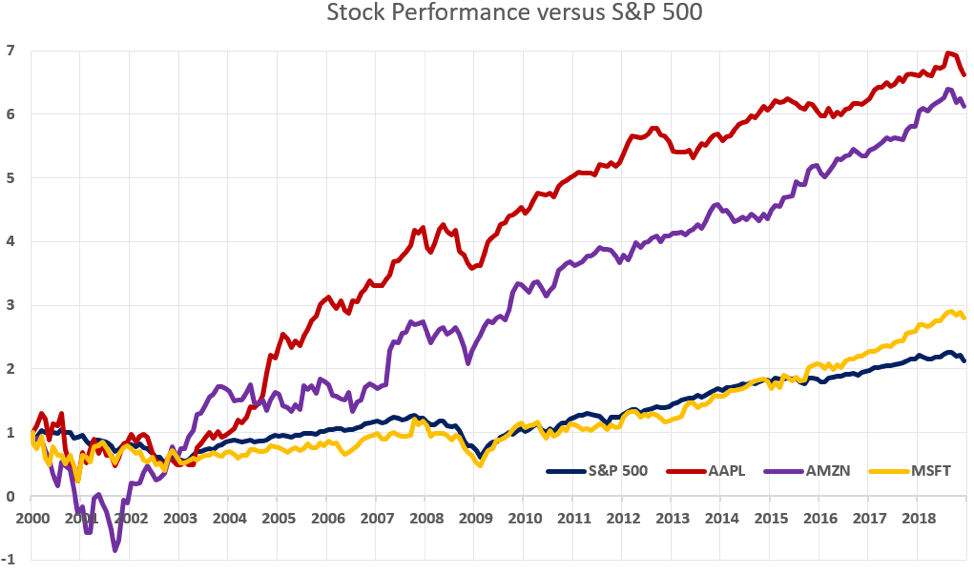
Note: Performance of $1 invested in the above named stocks versus S&P 500. Data source: CRSP (Center for Research in Securities Prices)