As the market hits new highs and valuations get more expensive, it is worth taking the pulse of the current situation and verify if financial markets find themselves in danger territory. One should also put current performance and valuations in the proper historical context and project out in the future based on the specific parameters of the investor’s allocation.
In this context, the Wall Street Journal has recently published a few interesting statistics; if one had started investing at the then top of the market in October 9, 2007, she would have still doubled her money (including dividends) in spite of entering the arena just before an historic drop. Such performance translates into an annualized total rate of return of 5.6% above inflation. Such rates compares with a 6.5%-7% average return over the last 200 years.
While this last decade was certainly a great case study as the success of the long term approach was validated by the ability to overcome ten years of great volatility, not every 10 year rolling period was so successful.
If one had started investing on January 1st, 2000, right before the major tech top and held positions for ten year all the way to December 31st, 2009, the annualized rate of return would have been a much less exciting 1.21% before inflation. Yet a positive gross return in the context of another very difficult decade. In order to strengthen the case for long-termism, if we assume an investment inception point at January 1st, 2000 and an ending point at December 31, 2016, the annualized total return of the S&P500 becomes 6.14% before inflation.
More analysis on 10 year rolling averages also shows some predictive power. The following chart (courtesy of Hefty Partners) shows the S&P500 10 year annualized rolling returns since 1937.
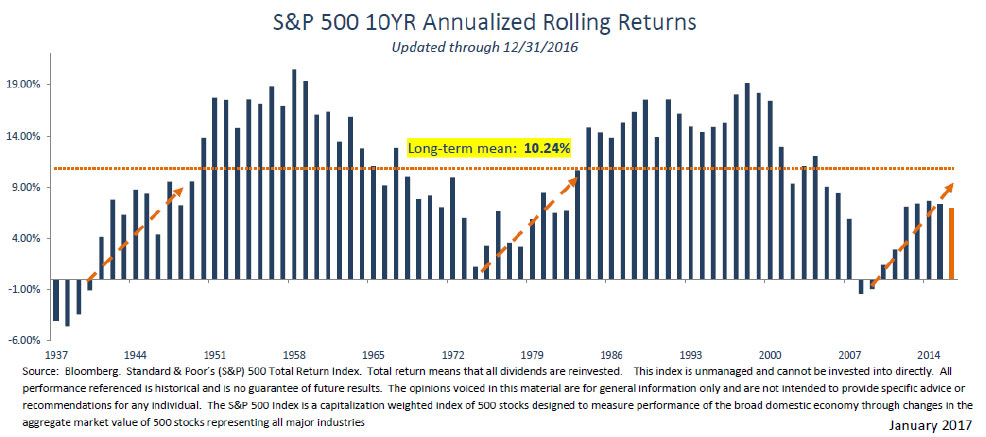
History shows that such rolling returns are cyclical and a few periods of lower than average returns are predictive of longer cycles of higher than average returns. Hefty Partners indicate that when the long term mean gets breached to the upside, annualized returns remain elevated above the mean for approximately 18 years. When the mean gets breached on the downside, annualized returns have remained weak and below the long term average for about 10 years. Currently we have not yet breached the mean to the upside and the rolling returns are still in the process of recovering from the lows of 2008. Should these fluctuations repeat their patterns in the future, investors may be expecting a few more years of elevated returns.
The chart also clearly indicates that holding period of 10 years rarely produce negative returns.
Currently, valuations are certainly less attractive than they have been in the last few years but not terribly higher than long term historical averages. The 25 year average for the S&P500 is 16 and the current P/E ratio stands at 17.7; high but not statistically frightening. Dividend yield and Price to Book are just in line with long term historical averages. Naturally, all these metrics are dependent on earnings and we shall know more as Q3 reports get under way.
With volatility at historical lows, we should also expect a pick-up in standard deviation but possibly not before the end of the year (unless earnings come in surprisingly lower than expected). This might be true as career risk may be pushing money managers toward overweighting the usual suspects in an effort to catch up with indexes whose performances have been trouncing most active managers.
From a valuation perspective, Emerging Markets are still a better deal than US stocks even though much of the valuation gap was arbitraged in the last 18 months. Global stocks in general (as represented by the MSCI All Country World Ex US Index) show a P/E ratio of 14.2, slightly lower than the 20 year average of 14.6.