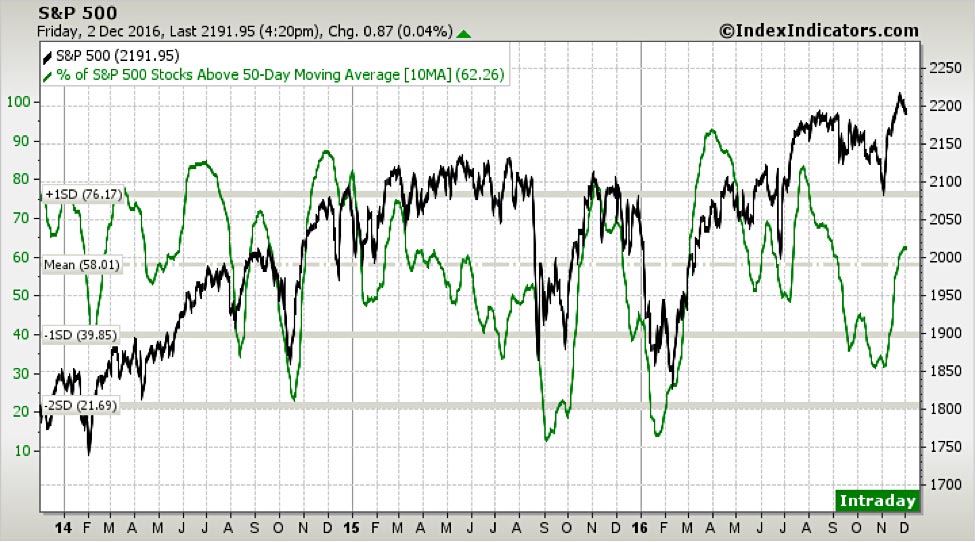
In an attempt to take the pulse of the market after the pre and post-election gyrations, we decided to look at three indicators that have shown a good market timing record. Courtesy of www.indexindicators.com, we start with a chart that focuses on market breadth or the level of stock participation in general price action. The following graph visualizes a 10 day moving average of the percentage of stocks above their 50 day moving average over a three year span. Currently this indicator is neutral but trending toward an overbought condition.
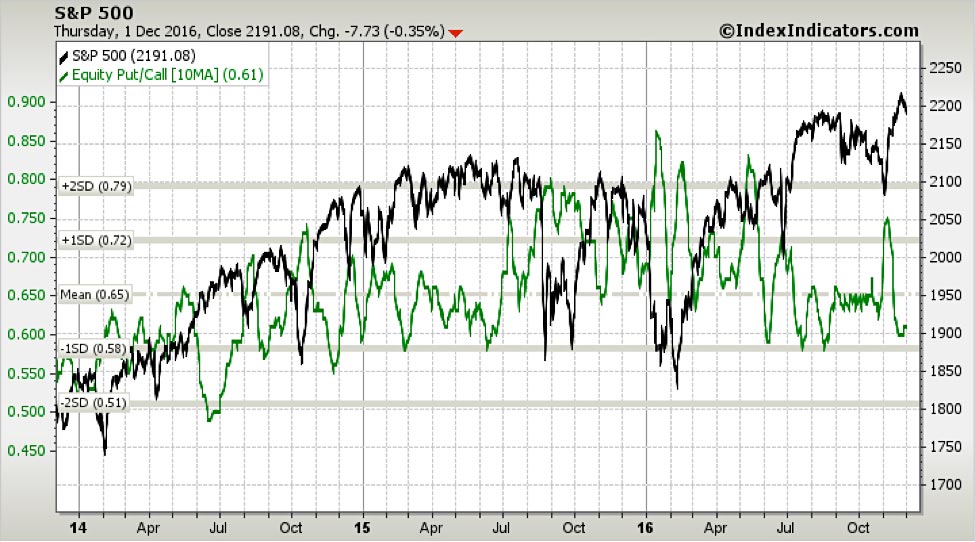
The next indicator is an equity put and call ratio also over a three year span. This indicator is designed to capture peaks of fear or complacency and has a contrarian nature. Currently, this put/call ratio shows some level of complacency albeit not extreme by historical standards (at least 2 standard deviations).
The last indicator we review is a similarly behavioral metric based on the VIX or the volatility index. Currently, this metric is more decidedly bearish by showing a level of complacency that over a five year period has generally being associated with short term pauses in market upside and in two occasions has marked deeper corrections.
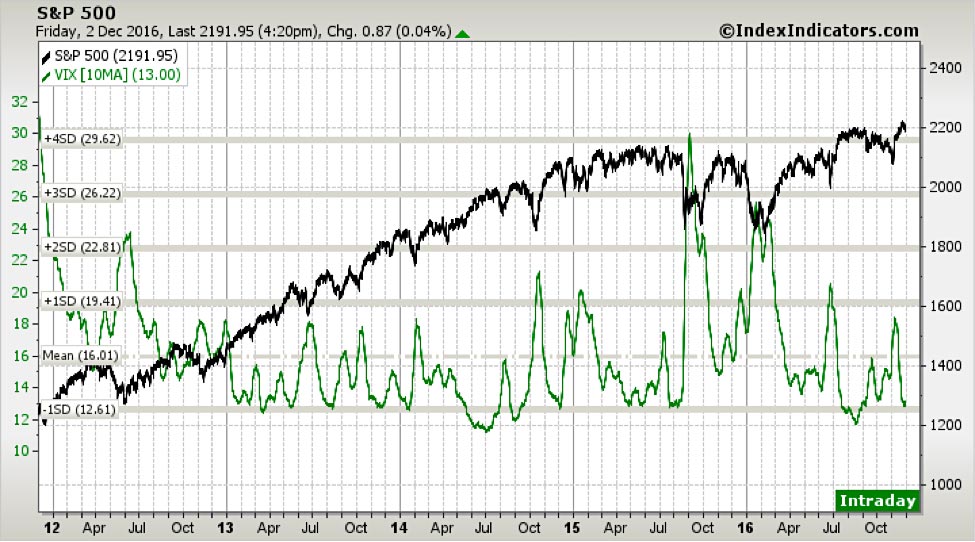
In conclusion, it would seem that the bullish Trump effect may be diminishing and a market reaction to a probable rise in interest rates at the upcoming Fed meeting is materializing. However, nothing in the technicals currently indicates high probabilities for serious dislocations.