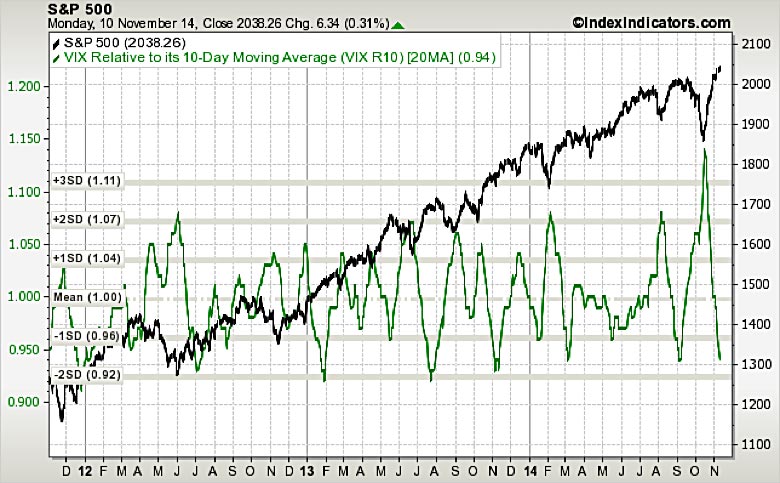
Interesting charts below from www.indexindicators.com showing a possible topping formation in the SP500 Index. The first chart shows a 20 day moving average of the VIX (the so called fear indicator) relative to its 10 day moving average. We are almost hitting the negative 2 standard deviations level which in the past has marked temporary tops in the market. In layman terms, the VIX essentially works like a contrarian indicator and at the moment it shows high complacency versus its recent values.
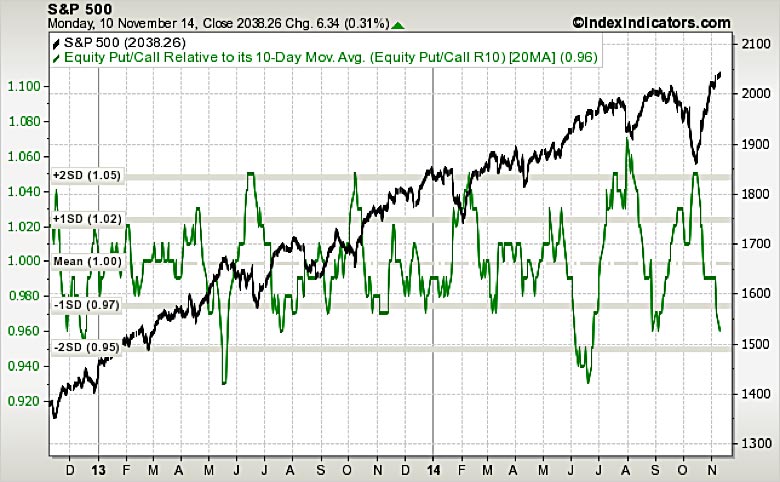
The second chart shows similar conditions by analyzing puts and calls. This indicator is similar in nature to the VIX and it is also manifesting complacency at levels that in the past have coincided with temporary tops in the market.